Win Rate
The share of closed trades with a positive result.
Winning trades ÷ all closed trades × 100
In this guide, breakeven trades stay in the denominator. A high win rate can still lose money when losses outweigh wins.

TRADING PERFORMANCE ANALYTICS · BTI PULSE
Win rate tells you how often you win. Trading performance analytics helps you understand what you earn, what you risk and how consistently you execute.
FIVE METRICS. ONE COMPLETE PICTURE.
Measure frequency, payoff and risk together. Use the same accounts, date range, trade definition and cost convention before comparing results.
The share of closed trades with a positive result.
In this guide, breakeven trades stay in the denominator. A high win rate can still lose money when losses outweigh wins.
The ratio of total winning P/L to the absolute total of losing P/L.
Use one cost convention throughout. With no losing trades, there is no finite ratio; a small loss-free sample is not proof of an edge.
The average result of a trade in the selected sample.
Calculate it in money or R. Positive historical expectancy describes the sample; it does not predict the next trade.
The decline from a previous peak to a later value in the same account series.
Maximum drawdown is the largest such decline in the period. A percentage calculation requires a positive peak.
Understand the account curve →A trade’s result expressed relative to its initial monetary risk.
A $200 gain against $100 of initial risk is +2R. Keep the initial risk as the denominator when reviewing the result.
Compare results in R →How many trades? Which period, account and market conditions? Were costs included? A single outlier or a short sample can dominate the result.
Build a consistent review →Definition reference: MetaTrader 5 report metrics. Calculation conventions in this guide are stated explicitly; check the convention used by your reporting software.
WORKED EXAMPLE · ILLUSTRATIVE DATA
The size of wins and losses changes the outcome. Here is a ten-trade sample with five wins at +2R and five losses at −1R.
Illustration only, not BTI customer results or a forecast. Starting balance $10,000; fixed initial risk $100 per trade; all displayed results are net of costs; no deposits or withdrawals. The sequence ends at $10,500. Closed-trade balance drawdown is $200 (2R), approximately 1.94% of the preceding peak. Intratrade equity drawdown is unknown.
With five wins at +1R and five losses at −2R, win rate is still 50%. But profit factor becomes 0.50 and expectancy falls to −0.50R per trade.
DRAWDOWN ANALYSIS
Two accounts can finish with the same profit after very different declines. Pair the final result with the depth and duration of drawdown, and be clear about the curve you are measuring.
Deposits and withdrawals can distort an unadjusted account curve. Use a consistent, cash-flow-aware method when comparing periods.
Tracks realized account results. It is useful for reviewing closed trades, but does not capture every fluctuation while positions are open.
Includes unrealized P/L. A trade that eventually closes in profit may still have experienced a substantial equity decline.
Closed-trade records alone cannot reconstruct the full intratrade equity path. Use the series, sampling frequency and drawdown type your source actually provides.
R · % · MONEY
Money shows the account impact. Percentage relates a result to a stated account value. R relates the result to the risk originally planned for that trade.
R-based expectancy is the average of individual R-multiples. With changing risk sizes, dividing total cash profit by one assumed risk amount gives a different answer.
The monetary risk defined before the trade.
The closed result after included trading costs.
$150 ÷ $100 of initial risk.
Illustrative trade. Planned reward-to-risk and realized R are different: actual exits, gaps and costs can change the outcome. If initial risk is missing or zero, mark R as unavailable.
BTI PULSE
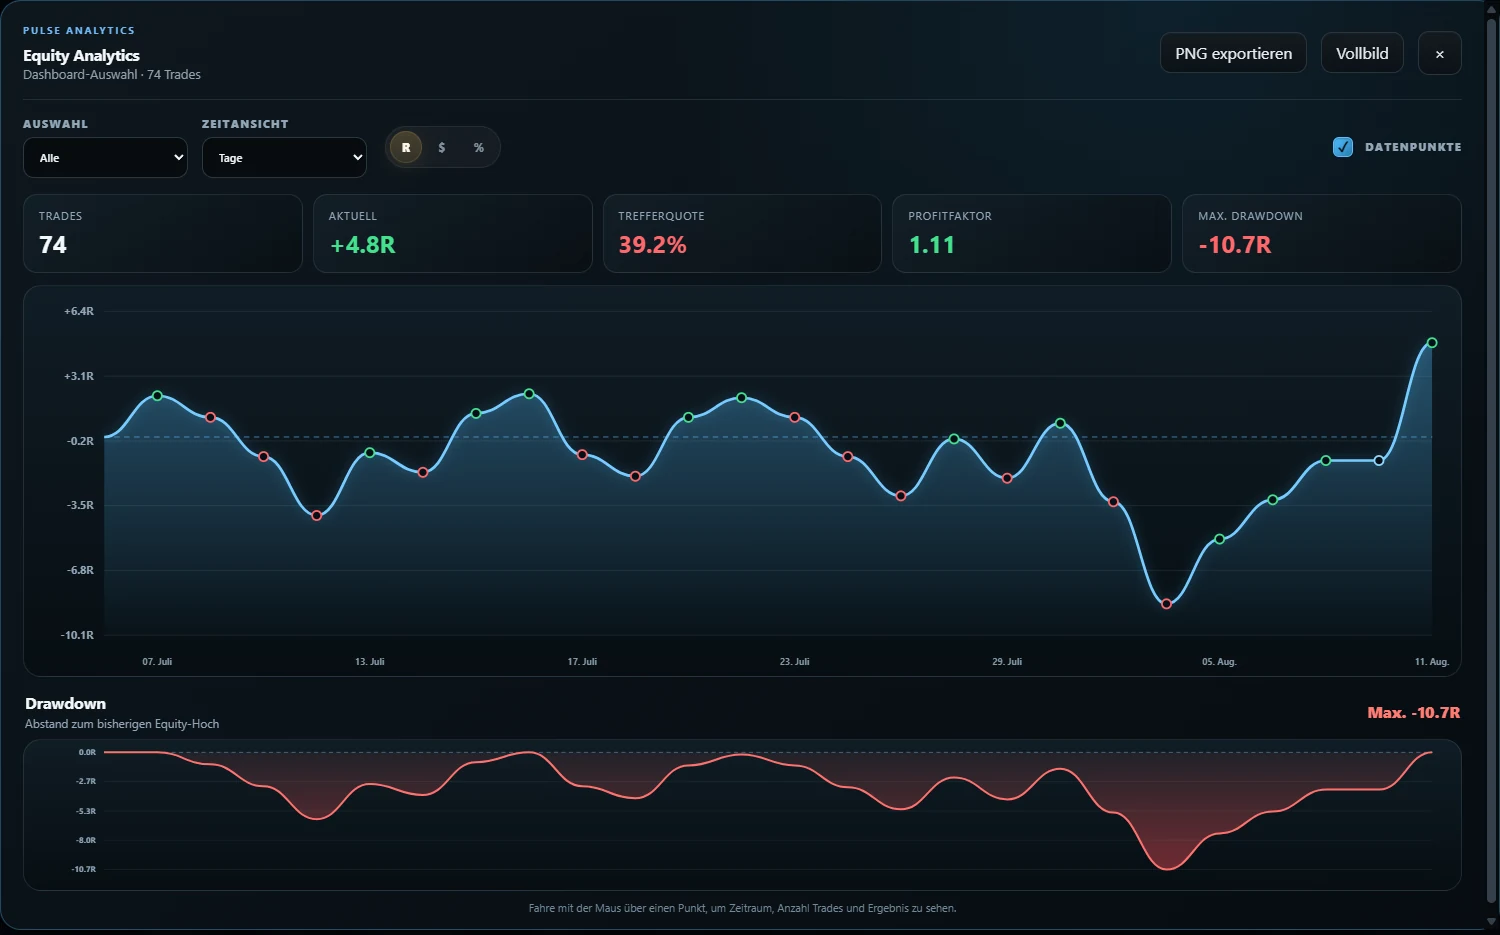
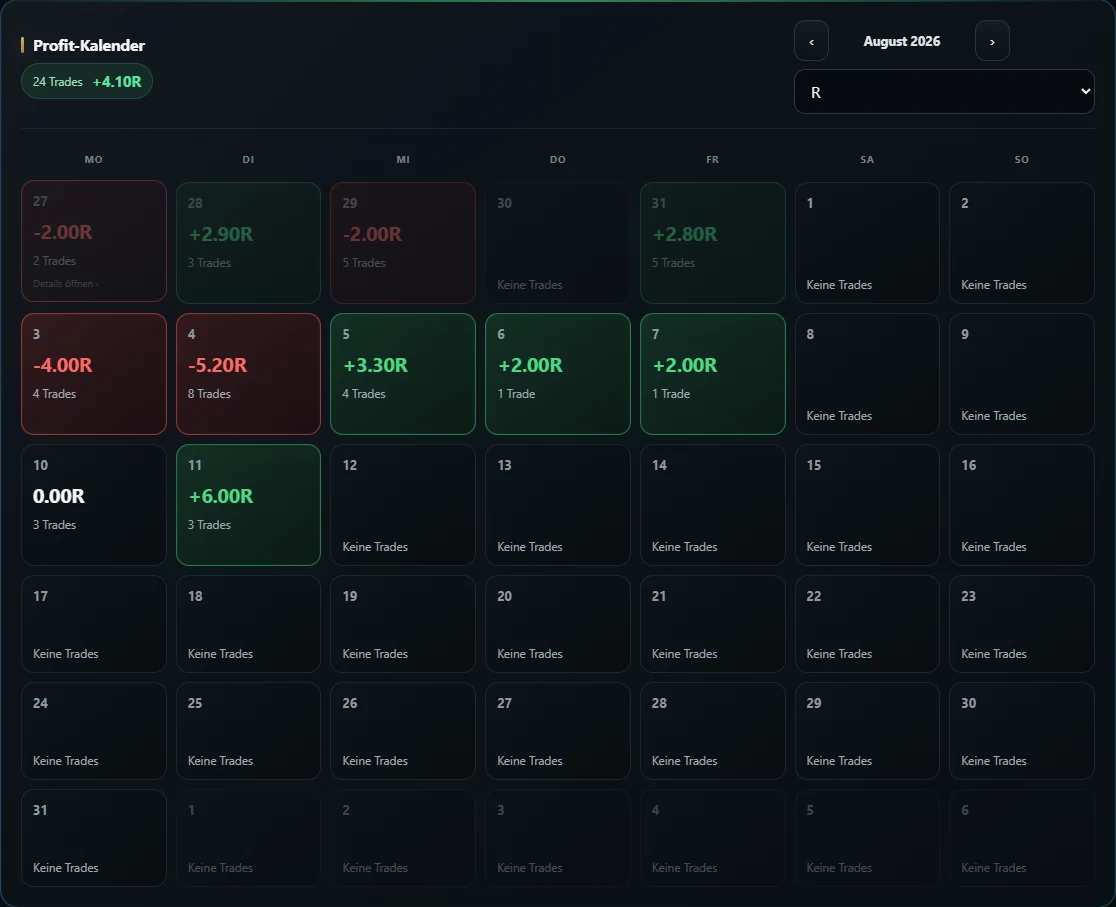
PULSE brings trading history, performance views and journal context together. Use its equity and drawdown views, R / % / money units, multiple accounts and structured reviews to investigate what sits behind the final P/L.
Review performance over time alongside the account’s declines.
Locate periods you want to investigate in your journal.
Keep different account histories organized.
Separate actual execution from historical testing.
Add context to outcomes and review execution against your plan.
Start manually or with supported imports. Add CONNECT for the manual MT5 workflow.
A REPEATABLE REVIEW
Use the metrics to choose what to inspect in your journal. Record what the sample supports and what remains uncertain.
Select an account, date range and consistent definition of a trade.
Check missing trades, duplicates, timestamps, costs and initial risk.
Read win rate, payoff, expectancy and drawdown together.
Review the trades and rule adherence behind unusual results.
Document a specific finding and revisit it with more data.
FAQ
Trading performance analytics uses trade records to measure results, risk and consistency. Read win rate, profit factor, expectancy and drawdown together, then use journal context to understand how those results were produced.
Yes. Frequent small wins can be outweighed by fewer, larger losses. Compare the size of wins and losses, include trading costs consistently and calculate expectancy for the same sample.
Profit factor compares total winning P/L with the absolute total of losing P/L. Expectancy measures the average result per trade. Both depend on the sample, units and cost convention you use.
Divide each closed trade’s net result by its initial monetary risk, then average those R-multiples. Keep the original risk denominator. Trades without a valid positive initial risk cannot be included in an R-based average without an explicit policy.
Balance drawdown follows realized account results. Equity drawdown also reflects unrealized profit and loss on open positions. A closed-trade history alone can miss the largest intratrade equity decline.
There is no universal threshold that establishes a robust trading process. Check sample size, average win and loss, drawdown, costs and changing market conditions. Historical statistics do not guarantee future results.
Yes. PULSE supports manual trade entry and supported imports. CONNECT is optional and adds the manual MT5 execution, position sizing and synchronization workflow.
BTI PULSE · PERFORMANCE & PROCESS
Bring your trades, account history and journal context into one performance center.
Explore PULSE