Use a previous high
The calculator tracks a running peak. A later value above it becomes the new peak for the next decline.

FREE TRADING TOOL · DRAWDOWN ANALYSIS
Measure the decline from an account peak to a later trough. See the loss in money and percent, the gain needed to recover, and the result in R when you provide your risk percentage.
Calculated in your browser. Values are not sent to BTI.
CALCULATED DRAWDOWN
Returning from 10,200 to 12,000 requires 17.65%.
Educational calculator. The approximate R-equivalent divides drawdown percentage by a constant entered risk percentage; it does not reconstruct historical R-losses when risk changed. Results do not predict future drawdown or establish a safe trading level.
READ THE ACCOUNT CURVE
A profitable period can still contain a deep decline. Drawdown starts at a previous peak and ends at a later trough, so chronological order matters.
The calculator tracks a running peak. A later value above it becomes the new peak for the next decline.
A lower value only counts against a peak that occurred before it. Sorting the data changes the answer.
Balance follows realized results. Equity also includes unrealized P/L and can expose larger intratrade declines.
Deposits and withdrawals can look like performance. Adjust them before comparing drawdown across periods.
THE RECOVERY GAP
After a decline, the account has a smaller base. The deeper the drawdown, the larger the percentage gain needed to return to the previous peak.
DON'T READ DRAWDOWN ALONE
Maximum drawdown describes one historical decline. It says more when you examine the same account, period and data convention alongside other performance measures.
Read total winning and losing P/L alongside the depth of the account decline.
Check the sample size, units and costs behind the average.
Use the initial monetary risk for each trade when calculating its realized R-multiple.
BTI PULSE
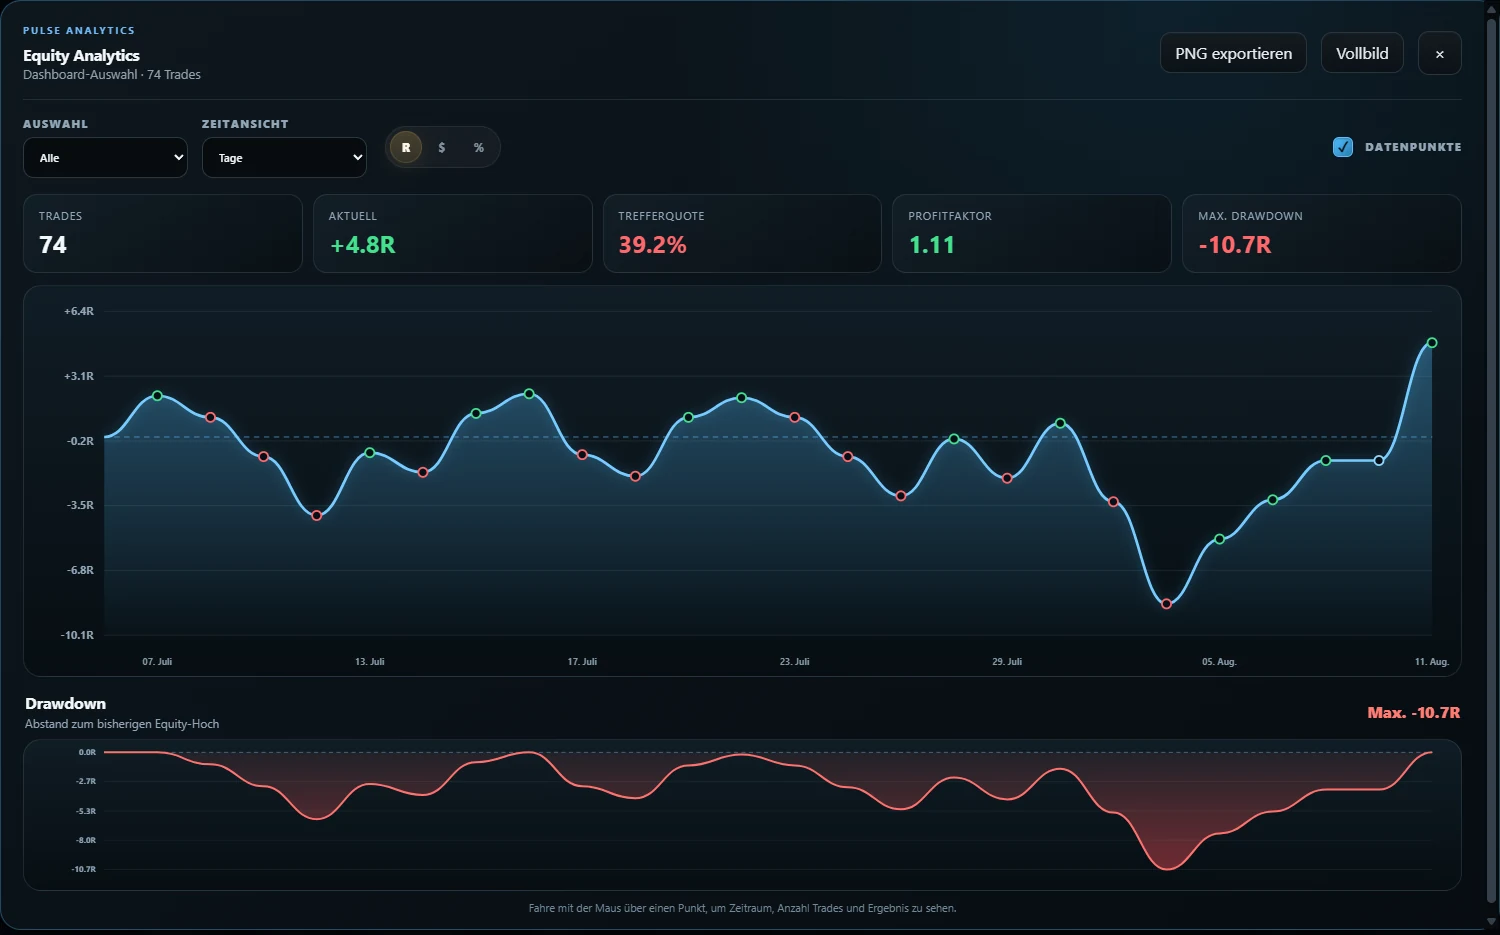
PULSE organizes trading history around performance and review. Use the equity and drawdown view to locate the decline, then inspect the relevant accounts, setups, rules and journal entries.
Review the account curve and its declines over time.
Change the unit while keeping the same performance context.
Keep separate account histories organized.
Connect the result with the trading decisions behind it.
A PRACTICAL DRAWDOWN REVIEW
Select the account, time period, currency and balance or equity series.
Check the order, missing observations and external cash flows.
Find the peak, later trough, decline and recovery requirement.
Review the trades, risk and rule adherence inside the decline.
Record what the data supports and revisit it with a larger sample.
FAQ
Absolute drawdown is the decline from a previous peak to a later trough. Percentage drawdown is that decline divided by the peak and multiplied by 100.
After a loss, the recovery starts from a smaller base. For example, a 20% decline from 100 to 80 requires a 25% gain on 80 to return to 100.
Maximum drawdown is the largest peak-to-later-trough decline found in the selected account-value series. The order of observations matters.
Balance drawdown follows realized account balances. Equity drawdown also includes unrealized profit and loss on open positions and can therefore reveal declines that closed-trade history misses.
Yes. External cash flows can create apparent jumps or declines that do not come from trading performance. Use a cash-flow-adjusted series before comparing periods.
Enter the percentage of the account represented by 1R. The calculator divides the percentage drawdown by that risk percentage. This is only a reference when trade risk changes over time.
No. Drawdown depends on the sample, data frequency, open-position treatment and market conditions. Historical drawdown does not set a limit on future losses.
FROM THE DECLINE TO THE DECISIONS
Use the free calculator for a quick measurement, then bring the trading history and journal context together in PULSE.
Explore PULSE