How many comparable trades?
A small or mixed sample can make win rate and average outcomes unstable.

FREE TRADING TOOL · PERFORMANCE ANALYSIS
Combine win rate, average wins, average losses and costs to estimate the average result per trade. Work in R so trades of different sizes remain comparable.
Calculated in your browser. Values are not sent to BTI.
EXPECTANCY PER TRADE
With these inputs, the average-value scenario is +0.21R per trade and +21.00R over 100 trades. This is not a forecast.
Educational calculator. Results are scenarios based on your inputs and do not predict future returns or the sequence of wins and losses.
THE EXPECTANCY FORMULA
A strategy can win often and still lose when its average loss is too large. It can also win less often and remain positive when winning trades are large enough.
EXAMPLE · 100 TRADES
READ THE RESULT CAREFULLY
A positive average can still include long losing sequences and deep drawdowns. The quality of the output depends on the quality and comparability of the underlying trades.
A small or mixed sample can make win rate and average outcomes unstable.
Outliers, partial exits and clustered losses can create very different paths to the same mean.
Use actual fills, costs and initial risk when evaluating completed trades.
CONNECT THE METRICS
Use the calculator as an entry point, then examine the ratio, drawdown and trade-level evidence behind the average.
BTI PULSE
PULSE organizes imported and reviewed trades into performance metrics you can filter by account, setup, instrument and period. Use expectancy beside win rate, profit factor, R-multiples and drawdown to investigate where results came from.
Review the average beside the sample that produced it.
Compare outcomes independently of position size.
Separate accounts, setups and trading periods.
Connect metrics with screenshots, notes and rule adherence.
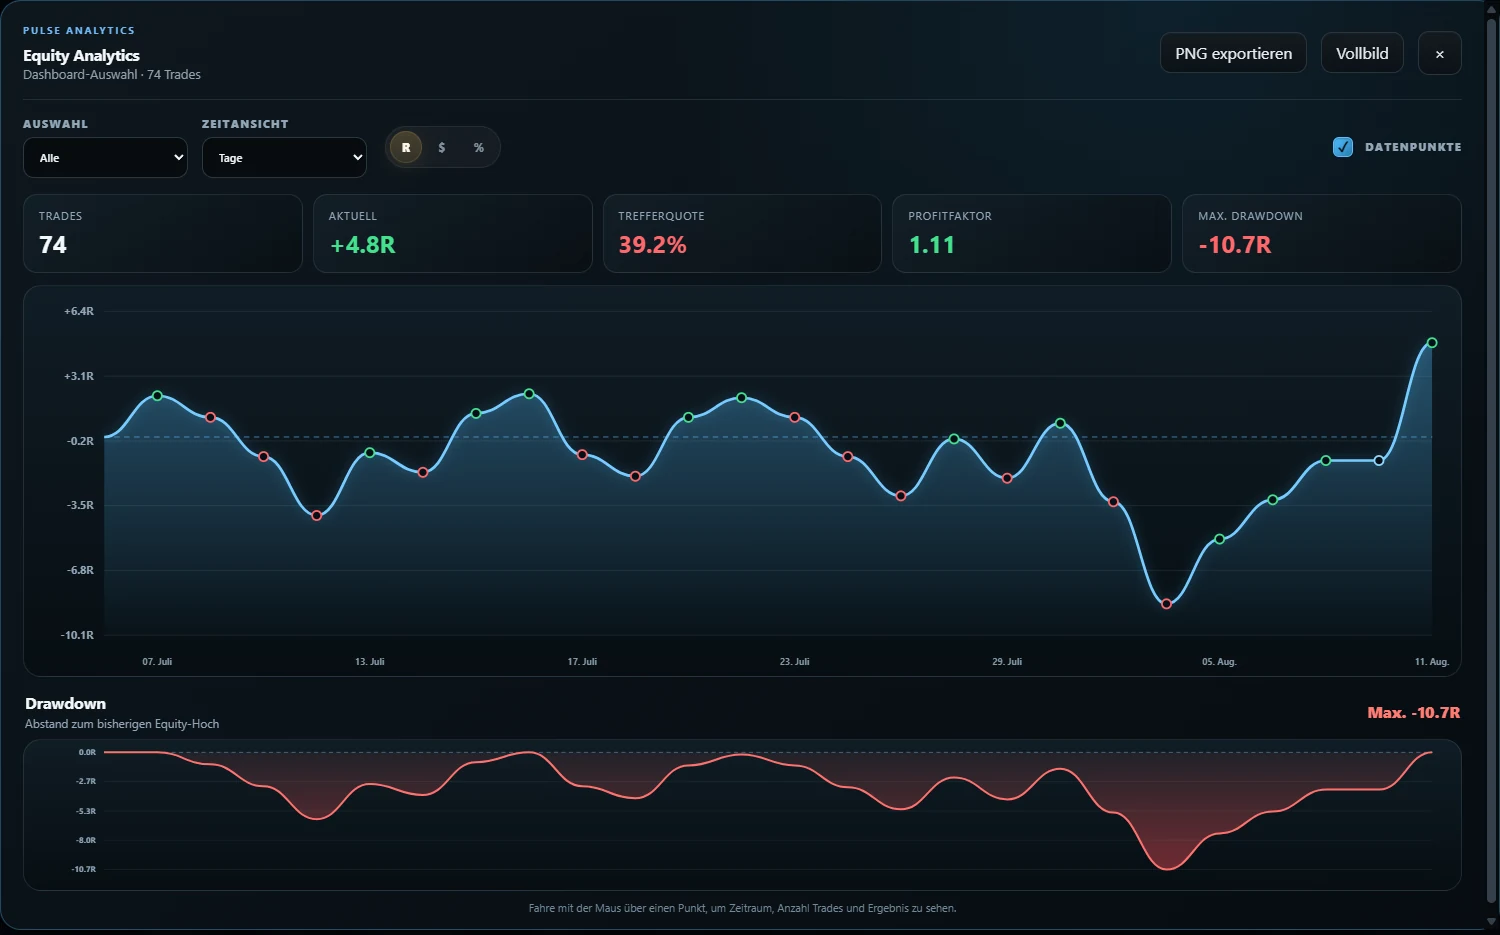
A PRACTICAL EXPECTANCY REVIEW
Select comparable trades from the same strategy and conditions.
Check fills, initial risk, costs and corrected trade data.
Measure win rate, average win, average loss and expectancy.
Change the assumptions and examine losing sequences and drawdown.
Find the setups and decisions that explain the result.
FAQ
Trading expectancy is the average result per trade implied by a win rate, average winning result, average losing result and trading costs. It can be expressed in money, percentage or R-multiples.
Multiply win probability by average win, subtract loss probability multiplied by average loss, then subtract average costs per trade. Enter losses as a positive magnitude in this calculator.
Positive expectancy means the entered averages produce a result above zero per trade. It does not guarantee that future results will be positive or that the input estimates are reliable.
Yes. A lower win rate can still produce positive expectancy when average winning trades are sufficiently larger than average losing trades and costs.
Commission, spread, slippage and financing costs reduce realized results. Even small average costs can materially change expectancy when the gross edge is small.
There is no universal number. Reliability depends on the strategy, market conditions, result distribution and consistency of execution. Use comparable trades and examine uncertainty rather than treating a small sample as conclusive.
No. It is a simple average-value scenario that assumes the entered statistics remain unchanged. Real sequences vary, losses cluster and future market conditions can differ.
FROM ESTIMATE TO EVIDENCE
Use the free calculator for a quick scenario, then bring the complete trading history and review context together in PULSE.
Explore PULSE