Choose the amount at risk.
Example: 1% of a 10,000-unit account equals 100 account units or 1R.

FREE TRADING TOOL · TRADE PLANNING
Compare the distance to your stop with the distance to your target. See the planned R:R, theoretical break-even win rate and optional account impact before you place the trade.
Calculated in your browser. Values are not sent to BTI.
PLANNED RISK : REWARD
At 1.00% account risk, this plan risks 100 account units for a potential 200 account units before trading costs.
Educational calculator. It does not assess setup quality, fill probability, spread, slippage or future performance.
THE R:R FORMULA
Risk is the distance from entry to stop. Reward is the distance from entry to target. Dividing reward by risk turns different prices and markets into the same planning language.
RATIO & BREAK-EVEN RATE
The figures below exclude spread, commissions and slippage. They describe mathematical break-even, not the probability that a target will be reached.
FROM RATIO TO POSITION SIZE
First define the maximum account risk. Then use the stop distance and the instrument's value per price movement to calculate position size.
Example: 1% of a 10,000-unit account equals 100 account units or 1R.
Measure from the planned entry to that technical invalidation level.
A wider stop requires a smaller position when account risk stays fixed.
BTI CONNECT
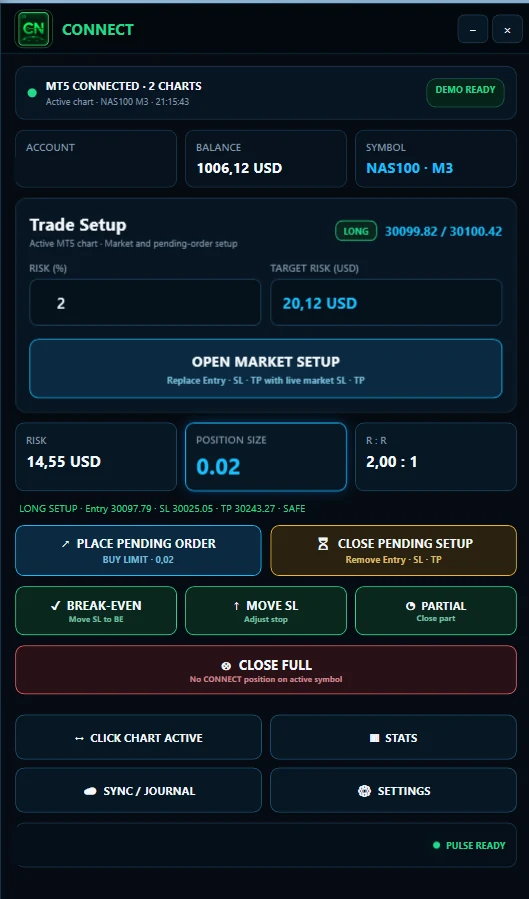
CONNECT turns entry, stop and target levels into a visual trade plan. Review the ratio, calculate size from your risk rules and prepare the order without switching between disconnected tools.
Move entry, stop and target lines directly on the chart.
Translate account risk and stop distance into position size.
See money, percentage and R before execution.
Keep the calculation beside the market context.
BEFORE YOU ACCEPT THE RATIO
Use a stop based on invalidation, not the ratio you want to display.
Check whether the target fits structure, volatility and holding period.
Account for spread, commission, swaps and possible slippage.
Calculate the position from account risk and actual stop distance.
Compare planned R with realized R in your trading journal.
FAQ
Divide the distance from entry to take profit by the distance from entry to stop loss. A reward distance of 100 points and a risk distance of 50 points produces a 1:2 risk-to-reward ratio.
It means the planned reward is twice the planned risk. If 1R equals 100 account units, the planned loss is 100 units and the planned profit is 200 units before trading costs and execution differences.
The theoretical break-even win rate is 33.33% before fees, spread, slippage and other costs. Real trading requires a higher realized rate or reward to cover those costs.
No. The target must still be plausible, the setup must have evidence and the stop must reflect the trade idea. Moving a target farther away only improves the displayed ratio, not the probability of reaching it.
The ratio does not set position size. Position size depends on the amount you are willing to risk and the entry-to-stop distance, adjusted for the instrument's tick or pip value.
Yes. For a long trade, the stop must be below entry and the target above it. For a short trade, the stop must be above entry and the target below it.
No. The calculator uses the price levels and optional account risk you enter. Include realistic execution costs in your own planning and review realized results separately.
FROM CALCULATION TO EXECUTION
Use the free calculator for a quick check, then bring entry, stop, target and position sizing together in CONNECT.
Explore CONNECT